(Page 5)
Hence, to determine the Peak Acceleration of a random test, we will find the (grms)2 area under the Power Spectral Density curve, take its square root and multiply it by 3. The required Peak Velocity and Peak Displacement terms can be found by synthetically integrating and double integrating the Acceleration PSD (dividing the amplitude of that spectrum by ω=2πf and by w2) and repeating these actions.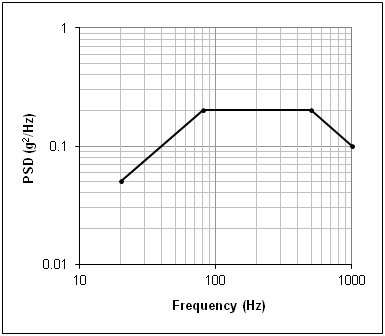
Figure 12: A typical random test profile displayed in log/log format.
At first glance, it would appear that calculating the area beneath the random test’s PSD would be a simple matter. Most test specifications contain a profile composed of straight-line segments, so that the required area is made up of triangles, rectangles and trapezoid – shapes with simple area formulas. But those spectra present the g2/Hz versus frequency on a log/log plot such as Figure 12. When the same spectrum is presented as a linear/linear graph (such as Figure 13), it becomes obvious that the inclined “lines” are actually curves.
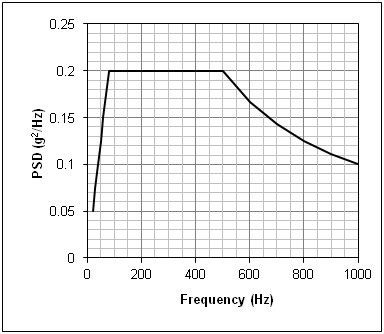
Figure 13: The test profile of Figure 12 displayed in linear/linear format.
In order to find the area under each (log A versus log f) PDF segment, we will need to have the A(f) equation for each curve. On the log/log plot, each straight-line segment can be described by:
y = mx + b
Where:
y = log10(A)
x = log10(f)
m = log10(A2) - log10(A1) / log10(f2) - log10(f1) = log10(A2/A1) / log10(f2/f1)
b = log_10(A_1 )
Hence: log10(A) = mlog10(f) + log10(A1)
From which:
1) A = A1fm (g2/Hz)