(Page 6)
We will also need the equivalent equations for segments of the velocity and displacement PSDs. These may be obtained by synthetic integration of equation 1. Recall A is of dimension g2/Hz where g is understood to be an RMS measurement. We require a velocity power spectrum, V, of IPS2/Hz amplitude and a displacement power spectrum, D, of inch2/Hz dimension where both IPS and inch are understood to be RMS units. The required segment equations are:

Adding the mean-square for all segments in the PSD yields the total mean-square values of acceleration, velocity and displacement. Taking the square root of each mean-square provides the RMS value. Multiplying the RMS values for g2, IPS2 and inch2 by 3 provides the peak acceleration, velocity and displacement. Multiply the displacement result by 2 to obtain a peak-to-peak value. Let’s consider an example.
Note that some specifications will specify the slope of rising or falling segments. The slope is normally presented in either dB/octave (decibels per frequency doubling) or dB/decade (dB change over a ten-to-one frequency span). This allows m to be evaluated as:
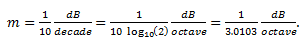
Figure 14: A Random Test Profile is a g2/Hz amplitude Power Spectral Density function.
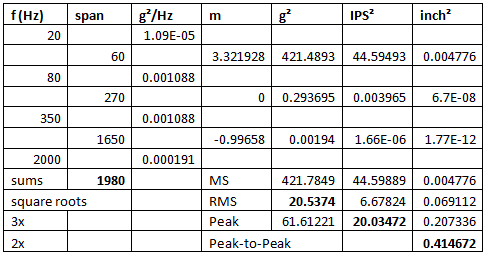
Figure 15: Calculating the span and peak acceleration, velocity and displacement for the test of Figure 11.