(Page 8)

Figure 18: Pre-pulse compensation of half-sine using two 20% rectangular pulses.

Figure 19: Post-pulse compensation of half-sine using two 20% rectangular pulses.

Figure 20: Pre & post-pulse compensation of half-sine using two 20% trapazoidal pulses.
Figure 18 presents pre-pulse compensation of the half-sine pulse. A test of this type might be used on a disk drive while monitoring read/write operation through and after the shock pulse. Pre-pulse compensation provides a clean after-pulse environment free of any “aftershocks”. This allows unambiguous diagnosis of after-shock read/write operational health.
In contrast, consider qualifying an automotive air-bag deployment sensor. One of the fundamental goals of such a test is to measure the acceleration g-level at which the sensor switch closed, causing detonation. Such a test is perfectly served by post-pulse compensation. Figure 19 illustrates the same half-sine test pulse compensated by the same 20% amplitude rectangular pulses.
Note that the duration of the compensation pulses is not arbitrary. Once the shape and height (of each) compensation pulse is selected, the duration of the two pulses needed to compensate the test pulse are unique. In Figures 18 and 19, the duration of the +.2 pulse is 2.580 time the duration of the half-sine. The duration of the -.2 pulse is 5.763 times the half-sine width. Hence, the compensated pulse is 9.343 times as long as the prescribed half-sine.
Note that pre-pulse or post-pulse compensation results in a one-sided or unipolar displacement. That is, only half of the shaker’s stroke is used. In order to run high-g pulse tests, it is necessary to employ the shaker’s entire stroke. This requires pre & post-pulse compensation, involving two compensation pulses of opposite sign before the test pulse and two after it. Figure 20 illustrates combined pre and post-pulse compensation of a half-sine using equal amplitude trapezoidal compensation pulses of 20% amplitude. Compare this with Figures 18 and 19 that illustrate the same test-pulse and note:
The peak displacement values are centered about the shaker’s mid stroke, doubling the available displacement range.
The total peak-to-peak stroke used is significantly less than that of a pre or post-pulse (only) compensated test.
The peak velocities are significantly lower for the pre and post-compensated test.
The total compensated pulse times are all about equal (≈9.5 times the half-sine duration).
By using two preceding and two following pulses, the controller can position the shaker armature to a negative displacement prior to the test-pulse with a negative velocity equal to about half of the velocity change induced by the desired test waveform. It will select these pulses so that the stroke used is centered in the shaker’s range. Thus, a modern controller allows the shaker system to deliver the most aggressive test-pulse possible within its physically limited stroke and velocity capabilities. At first blush, this all seems too good to be true. However, it is the natural result of using shorter compensation pulses.

Figure 21: Compensation results for various Classical Shock pulses.
Figure 21 provides pre-pulse, post-pulse and pre & post-pulse compensation results for the most common Classical Shock pulses. All compensations tabulated in Figure 21 assume 3% pre-pulse amplitude and 15% post-pulse compensation pulses of half-sine shape. Select a pulse shape, acceleration amplitude, g, and pulse duration, T. Read the peak velocity as a multiple of gT, and the stroke as a multiple of gT2.
For example, if you desired to run a 5 gpk half-sine pulse of 11 ms duration, using Pre & Post-Pulse compensation read (in English units) Peak Velocity/gT = 165.4 and PTP Displacement/gT2 = 320.5. Then calculate:
1) Peak Velocity = 165.4 gT = 165.4*5*11x10-3 = 9.097 IPS
2) PTP Stroke = 320.5 gT2 mm = 320.5*5*(11x10-3)2 = 0.1939 inch
The solutions presented in Figure 21 are not general. They may be inappropriate for a specific test, but they do provide a convenient means of comparing the utility of specific shaker systems. Modern vibration controllers can combine a myriad of pulse shapes to provide optimization for stroke, velocity and the energy imposed on the test object.
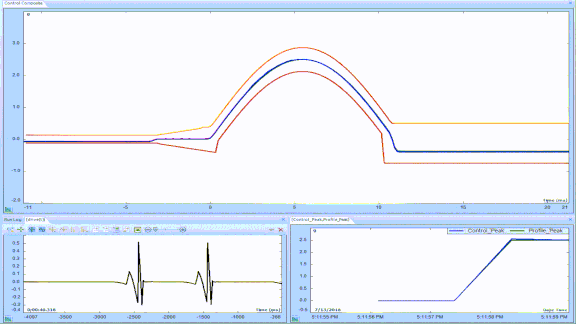
Figure 22: Classical Shock Test Profile is an acceleration-versus-time history.
Figure 22 illustrates a Classical Shock Test Profile as seen on a Crystal Instruments vibration controller. The selected half-sine test pulse (and its allowable tolerance band) are shown in the main display panel with smaller panels presenting the velocity and displacement time histories. Computed extreme values of the required acceleration, velocity, displacement and force are tabulated in the lower right pane.
Figure 22 should be viewed as extremely good news for any reader feeling burdened by the arithmetic discussed in this section. Firstly, we are through the “tough part”. Secondly, all Crystal Instruments controllers automatically do these calculations (and a lot more) for you whenever you specify a test profile. In fact, the test requirements can simply be recalled from the test library and melded with the shaker specifications stored in the shaker library. The controller then performs a feasibility analysis before attempting to conduct the test and will stop impractical application without risking the shaker system in any way. But to enjoy such convenience, you must first own a controller. Assuming you don’t currently have such an instrument, we will continue with the selection process.