Sine Testing
A Swept Sine test is a type of vibration test where the controller excites one specific frequency via sinusoidal voltage drive. As opposed to a Random test, where a broadband of frequencies is excited together like white noise, the Swept Sine test produces a response with energy in the primary frequency and its harmonics (i.e., frequencies that are multiples of the primary frequency).
The specifications for a Swept Sine tone are usually defined in terms of frequency and amplitude, as well as time spent for each tone. For the common setup of a control channel reading from an accelerometer, the amplitude is defined in Engineering Units (EU) peak, where EU is a stand-in for a unit of acceleration such as m/s2 or g.
The question is: should we account for these harmonics in our Sine amplitude peak calculations? If so, how do we incorporate them? With Swept Sine tests, the four most common measurement strategies are described below.
Measurement Strategies
Tracking Filter: the most common approach is to use a tracking filter, a bandpass filter that only measures the energy around the central frequency of the filter. A tracking filter is also configured with a filter width, which determines how much of the neighboring energy to capture. By using a tracking filter, the amplitude is precisely tailored to specifications at the control frequency. If there is any response in the harmonics, those components are excluded from the amplitude calculations by design.
Note: if the shaker system has significant nonlinearities (e.g., hydraulic shaker), much of the energy imparted onto the test object could be in the harmonics. In these cases, using a tracking filter could bias towards over-testing because the control calculations are not accounting for the energy in the harmonics.
RMS: another approach is to measure the total energy of the spectrum by using the RMS of the time domain signal. By Parseval’s Theorem, the RMS of the time domain signal is equivalent to the RMS of its frequency domain counterpart. If there is a response in the harmonics, those are included in the amplitude RMS calculations. If necessary, the calculated RMS is scaled by 1.4 to convert to EU-peak units (accounting for the natural scaled relationship between a sine wave’s peak and RMS).
Mean: a similar approach to RMS, this method takes the arithmetic mean of the absolute values of the time domain points, instead of taking the RMS. If necessary, the calculated mean is scaled by 1.57 to convert to EU-peak units (accounting for the natural scaled relationship between a sine wave’s peak and mean).
Peak: this approach takes the maximum peak value measured in the time domain frame. Using peak will bias towards under-testing the article and over-estimating the g-levels in the control channel, because the various Sine components will occasionally overlap and create an inflated peak value. This is the most conservative way to account for any energy in the harmonics when calculating the control amplitude spectrum.
Example with Sine waves
Consider the following example of a sine wave superimposed with a harmonic (third harmonic, ¼ amplitude). The top half shows each individual sine component, while the bottom half shows the combined signal.
Then consider the configuration except with the third harmonic’s phase shifted 180°. The overall energy and RMS of the signal will be the same, but the peak and mean values will be different:
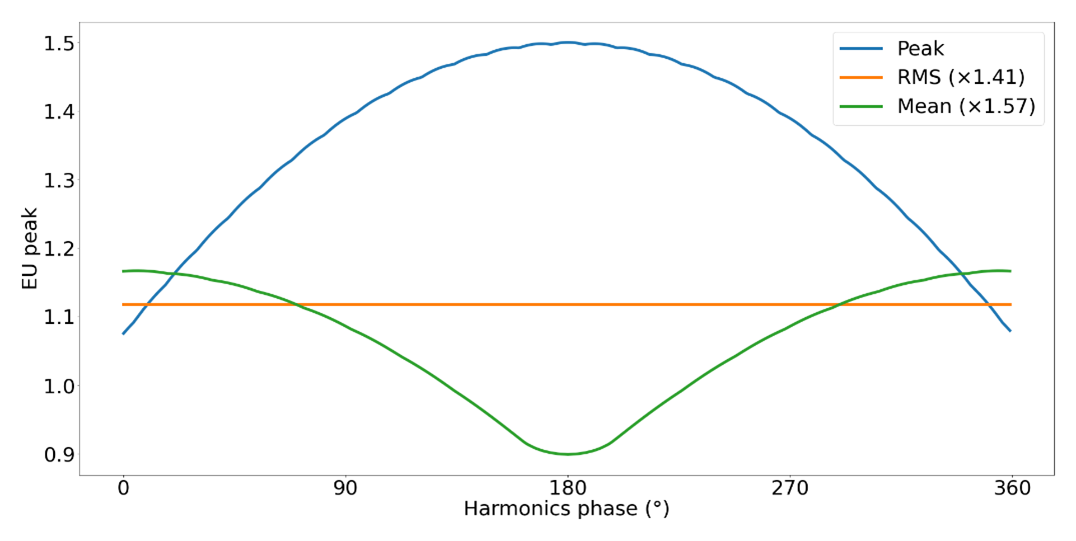
Indeed, if we calculate and plot the RMS, peak and mean values for each possible configuration by varying the phase of the third harmonic from 0 to 360°, we can see how the peak and mean values change but the RMS stays the same. Note that we scaled the RMS by 1.41 and the mean by 1.57 for a consistent comparison in engineering units peak.
Demonstration
To demonstrate the different effects of each measurement strategy, we applied the following setup: one Spider vibration controller ran a Multi-Sine test at the primary frequency of 100 Hz, with additional energy exciting the harmonics.
Then, we T-ed the control channel to an auxiliary channel in a separate Spider vibration controller running a Sine test at 100 Hz to observe the differences in the respective measurement strategies.
The final result can be seen in the above plot. Given the same control channel signal, the Sine measurement strategies can be ordered from highest to lowest: Peak, RMS, Mean and (Tracking) Filter. This validates the descriptions of each measurement strategy in the section above.


