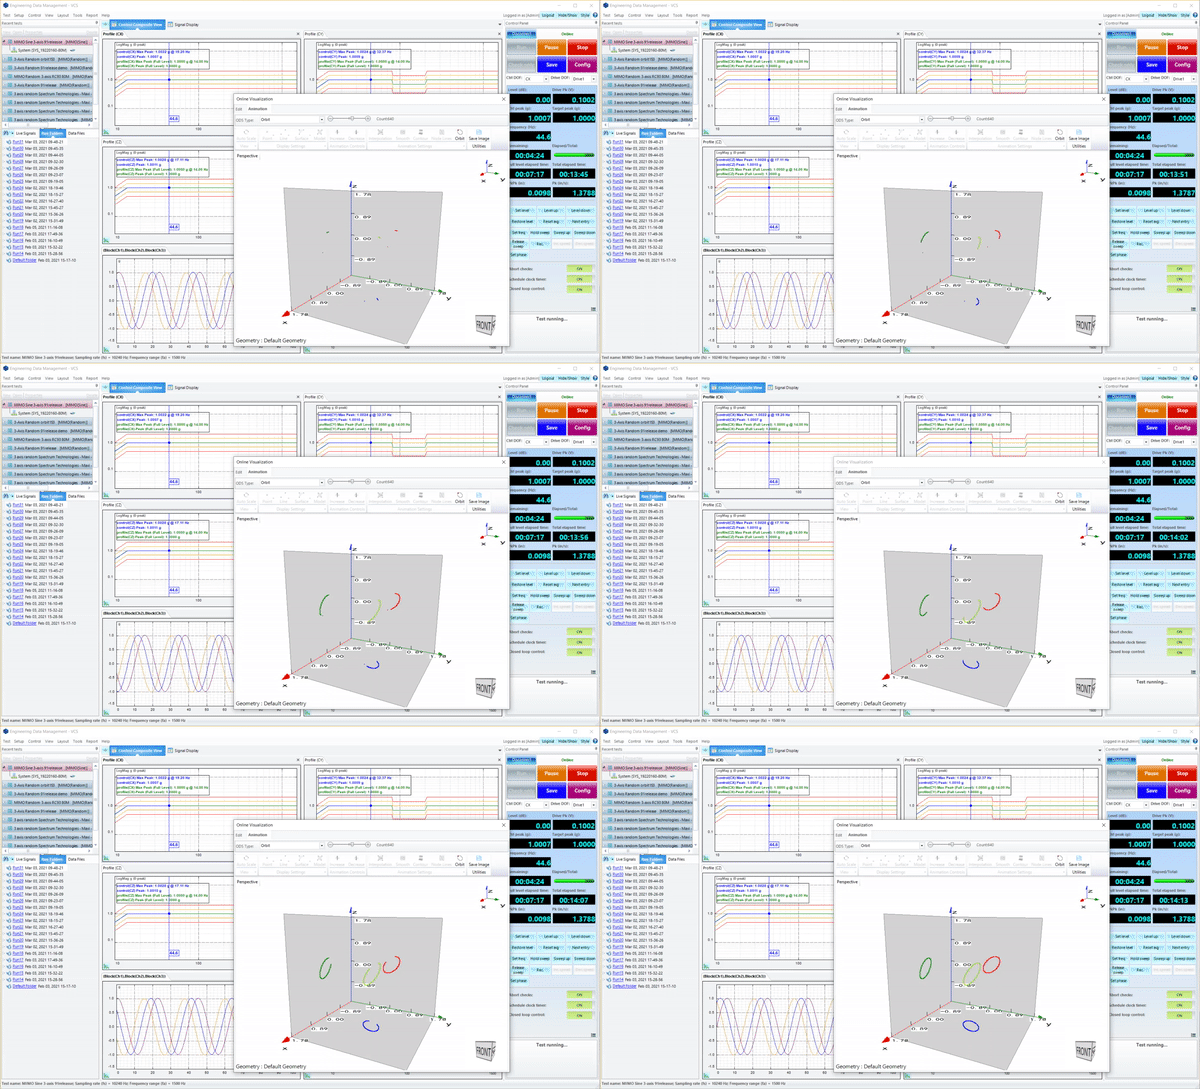
This section describes the orbit plot feature in the vibration visualization function. In-depth details about the workflow of the vibration visualization process will be discussed in the later portion of the article. The orbit plot is not only used to understand the magnitude of the vibration during a vibration test but also to observe the phase relationship between the different channels used to acquire the response of the unit under test. This is understood more clearly using a test case.
Read MoreThe Minimum Energy option of MIMO Random is implemented to handle the nonlinearity of a multi-shaker table and provide fast convergent control.
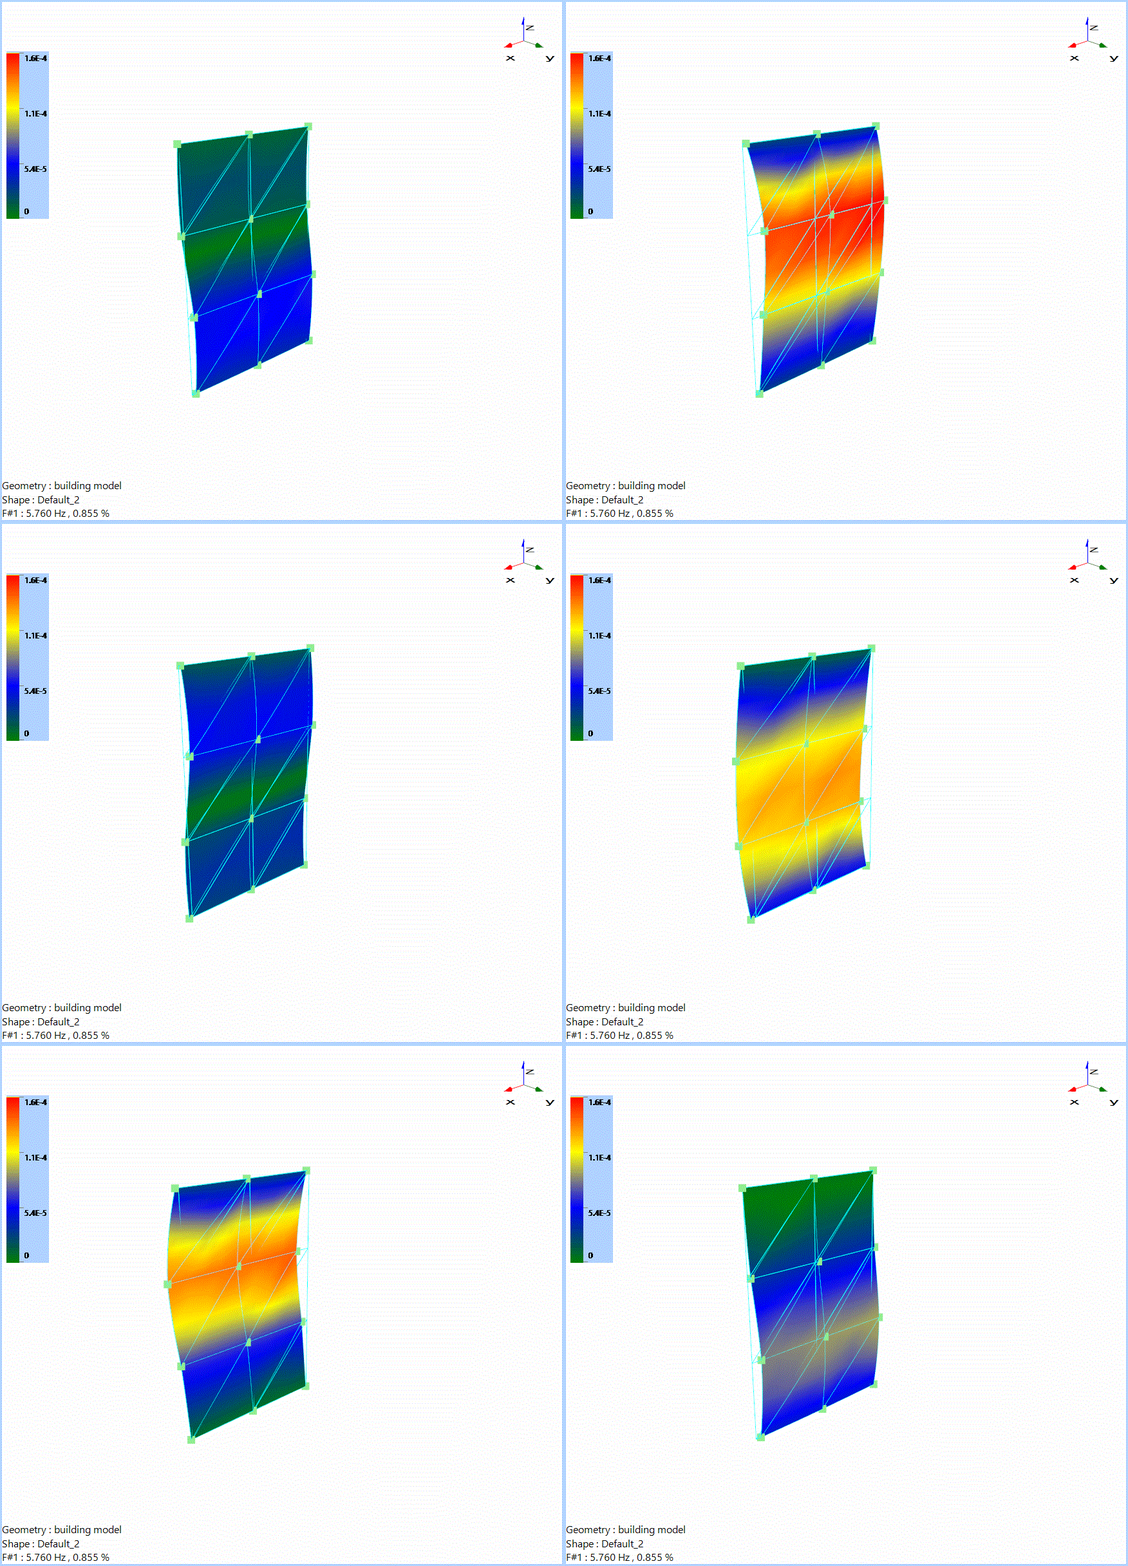
Read MoreOperational Modal Analysis (OMA) is commonly used to monitor and evaluate the health of building structures to investigate for any damage [1]. Studying the modal parameters of the structure can assist in observing changes in the dynamic properties which can further help in predicting error in certain elements which might need some repair or modification.
Read MoreA modal test is carried out to examine data obtained through regular FFT technology and MR technology to quantify the modal results, such as damping, FRF amplitude, Auto-MAC chart, and mode shapes.
Read MoreSentek Dynamics and Crystal Instruments successfully installed a massive shaker at Tesla, Inc. in Fremont, California, USA. This is the first large scale system of its kind for mechanical vibration and shock testing, featuring a payload of over 4400 lbs and dimensions of 87 inches x 86 inches x 32 inches.
Read MoreTwo somewhat arbitrary types of excitation signals are Pseudo Random and Periodic Random. The characteristics of these two signal types will be discussed in detail here. The results of using these excitation types will be compared to the more popular Pure Random and Burst Random types. It will be shown that the cost of additional testing time is well worth the superior estimation of MIMO FRF signals.
Read MoreSentek Dynamics utilizes Crystal Instruments’ Random Vibration Testing System to address the 6-Amazon.com testing requirements. Contract environmental testing services are provided at our testing facility in Charlotte, North Carolina. The THV Environmental Testing system provides one comprehensive testing report for the user’s convenience. Consult with a Sentek Dynamics representative to discuss the right solution for your needs.
Read MoreLithium-ion batteries are gaining popularity as the most common battery type used for electric vehicles. During their lifespan, these batteries undergo a variety of vibrations and temperature changes. Several common test standards have developed to simulate the long-term environmental effects on these batteries across different size levels (e.g. cell, module, pack).
Of the many test standards for EV batteries, this post will specifically focus on the vibration and temperature aspects of four well-known standards: SAE J2380, SAE J2464, IEC 62660-2, and UN 38.3.
Crystal Instruments Spider systems can provide solutions for random, sine, and shock vibration test, as well as temperature control.
Read MoreIn this case, the modal characteristics of an airplane model is acquired by performing experimental modal analysis. A SIMO FRF test is carried out using a single modal shaker and multiple sensors to obtain the vibration characteristics. Shaker excitation provides better consistency and repeatability than a modal hammer. It also produces a cleaner data set because of a greater average. The higher quality measurements lead to a better estimation of the modal parameters.
Read More


